If you’re new to developing in WebRTC, you may have discovered that it can be a bit frustrating from time to time to figure out where your issue is. With the media flowing all around, you might not know exactly where you’ve hit a snag. In this blog post we’re going to cover a couple tools that will help you to more quickly diagnose the problem and get yourself back on track.
Now if you have a great JavaScript SDK then you don’t have to worry about much of this. With our WebRTC platform you can utilize our SDK and with a few lines of JavaScript you’ll be up and running. But sometimes you want to look under the covers or blaze your own trail—in those cases, you need the right tools at your disposal.
One of the things that you want to be able to keep an eye on is if media is flowing in both directions. You can shout “test, test, TEST” all day long, but if you didn’t add Participants into the session, the media will never show up—so let’s dive into the right way to resolve this issue.
WebRTC Internals
Modern browsers are extremely helpful here. We’ll specifically be looking at Chrome, but Firefox has tools here as well. WebRTC Internals is a tool within the guts of Chrome that shows us all the details of your WebRTC connections. Let’s start by opening it up! Head on over to chrome://webrtc-internals/ and let’s see what we get.
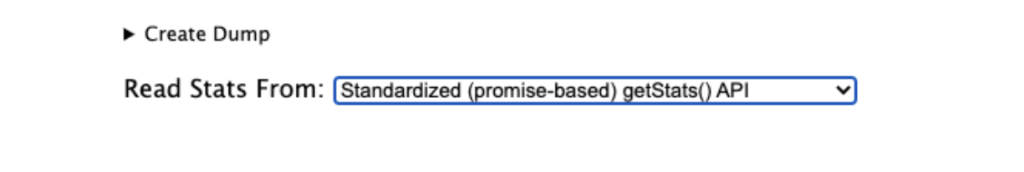
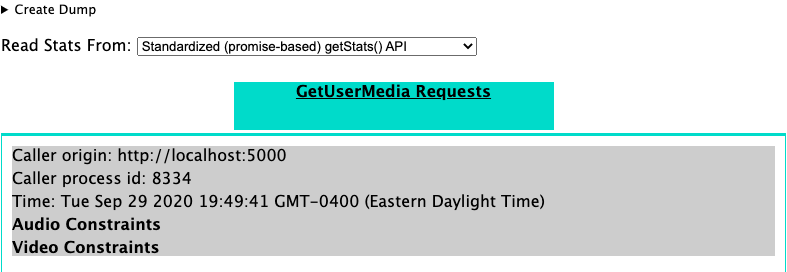
Oh, hmm, not that interesting. Well, that’s probably because nothing is using WebRTC in this browser. So after opening up one of my sample apps, we’re able to see some information in this viewer. Below we see that there has been a media request (getUserMedia()), but no RTCPeerConnections yet. Once we create an RTCPeerConnection, in this case by calling the connect() function in our JavaScript SDK, we’ll see this viewer really kick to life. One thing to note here is that WebRTC Internals should be open before you kick things off, they won’t catch things that have already happened or are already running.
Now there is an RTCPeerConnection to localhost, having clicked on that we see a number of interesting options. We’ll leave exploration of all of those fields to another blog, for now, let’s focus on the RTCOutboundRTPAudioStream_* area. When we expand that, we see that we have media flowing outbound, as you’ll see near the end of the clip below.
We’ll also note that the Stats graphs for RTCInboundRTPAudioStream_* shows nothing (though we’ll see more on why in a moment), but the lack of any Inbound data packets tells us we have one-way media flowing.
Once we initiate the other leg, in this case by creating an outbound PSTN phone call and transferring it into our WebRTC session, we will see that an additional RTCPeerConnection shows up—this is easier to see in the final video below. This RTC Peer has a section “Stats graphs for RTCInboundRTPAudioStream_*” where we see some real action!
You’ll note that we’ll never actually see inbound media show up in the original WebRTC section, it is only for the outbound stream. If you scroll through these sections you’ll see quite a few different metrics on packet loss, jitter, buffer usage, etc—these can be helpful in debugging quality issues, should you have those crop up. But for now, we’ve used this to help us determine that media is flowing. Here we can see the whole chain of events unfold from the perspective of WebRTC Internals. This blog just scratched the surface of WebRTC Internals. If you want to learn more, the great folks at testRTC have a few articles that help you to dig deeper.
WebSocket traffic in the inspector
WebSockets are often used for signaling to help establish the WebRTC session before you can send or receive media. If you aren’t getting media, then you may need to investigate that initial negotiation. This is where the websocket inspector can come in handy.
Once you’ve gone far enough with your SDK to initiate that connection you can leverage the built-in inspector to see the conversation taking place. Again we’ll look at Chrome to see how this plays out.
Most web developers will be familiar with this screen, but if you haven’t used it before, you’ll just need to go to View>Developer>Inspect Web Elements. We’ll be visiting the Network tab within the inspector interface. As for webrtc-internals, this should be open before you initiate the requests otherwise they won’t show here.Once we kick off the Javascript call that establishes the websocket and starts the negotiations, in this case connect(), we’ll be able to look at what is passed back and forth. In this video, you can see that by clicking on the entry ?token=… the websocket conversation is revealed. And by clicking on any of the individual messages, we can see all the content that is passed back and forth.
It’s good to look for error messages, like for example if you didn’t grant the proper permissions. You can check that your auth information has been sent properly as well. And lastly we have the SDP negotiation line items—which can be helpful if you set any constraints.
Now that you know it’s here, you can dig in and have a better understanding of how your session is getting established.